As we prepare to engage our board of directors, understanding how to effectively report our Net Promoter Score (NPS) is essential. This metric serves as a significant indicator of customer loyalty and can shape our strategic decisions. In this article, we will delve into the fundamental components of effective NPS reporting, ensuring that our insights align with the leadership’s focus on metrics that drive growth and retention. By incorporating best practices in NPS reporting, we aim to present data that not only reflects customer sentiment but also highlights its potential impact on our business strategy.
Key Takeaways
- NPS serves as a key metric for measuring customer loyalty.
- Effective NPS reporting is essential for strategic alignment with leadership goals.
- Understanding customer sentiment can aid in decision-making.
- Highlighting the impact of NPS can drive focus on metrics that foster growth.
- Utilizing best practices in reporting enhances the clarity of our insights.
Understanding the Importance of NPS
The Net Promoter Score serves as a crucial metric that gauges customer loyalty through their likelihood to recommend a company. By focusing on this score, we can better understand our customer base and identify areas for improvement in our offerings.
Defining Net Promoter Score
The NPS definition centers around the categorization of customers into three groups: promoters, passives, and detractors. Promoters are enthusiastic supporters who are likely to recommend our brand, while detractors can harm our reputation through negative feedback. This segmentation reveals vital insights into customer satisfaction levels and helps us adjust our strategies accordingly.
The Role of NPS in Customer Loyalty
A strong correlation exists between a company’s Net Promoter Score and its customer loyalty. Research illustrates that organizations boasting higher NPS often enjoy increased customer retention and greater revenue growth. By consistently monitoring this score, we gain a clear view of customer sentiments, allowing us to tailor our engagement efforts to foster loyalty.
How to Prepare for the NPS Presentation
Preparing for an NPS presentation requires a strategic approach focused on gathering relevant NPS data and engaging the right teams involved. The effectiveness of our presentation hinges on clear communication and thorough analysis.
Gathering Relevant Data
We must collect both quantitative and qualitative insights from our Net Promoter Score surveys. The inclusion of demographic breakdowns in our data will significantly aid in analysis and provide a comprehensive view of customer sentiment. Key aspects to focus on include:
- Overall NPS score trends
- Customer segments reflecting promoters, passives, and detractors
- Comments from respondents providing context to the scores
- Trends over time to illustrate changes in sentiment
Identifying Key Stakeholders
Identifying stakeholders who will benefit from the insights gathered through the NPS is crucial. These may encompass teams from:
- Marketing
- Sales
- Customer service
- Product development
Clear communication channels with these teams enables us to tailor our report to meet the interests and concerns of the board effectively. Understanding their alignment with customer feedback will enhance our presentation’s value.
Net Promoter Score Measurement
Understanding Net Promoter Score measurement is crucial for maximizing customer insights. The first step involves choosing the right NPS survey platform, which has the capabilities to effectively capture customer feedback. A variety of solutions exist, including notable options like SurveyMonkey, Typeform, and Qualtrics, each offering unique features tailored for our feedback collection processes. These platforms enable us to customize surveys, select distribution methods, and analyze results efficiently.
Choosing the Right NPS Survey Platform
When selecting an NPS survey platform, we should consider factors such as usability, scalability, and the specific features necessary for our business needs. A well-chosen net promoter score software can streamline the survey process while providing insightful analytics. Here are some key considerations:
- User interface – An intuitive design helps in creating a smoother experience for both the creator and respondents.
- Customization – Our branding should reflect in the surveys to enhance recognition.
- Analytics – Robust reporting tools will help us interpret data effectively.
- Integration – The ability to connect with other software for seamless data sharing.
Best Practices for Collecting Feedback
After choosing an NPS survey platform, we must implement best practices for collecting feedback to ensure we get meaningful results. These practices include:
- Targeting the right customers – We should focus on customers who have recent interactions with our products or services.
- Timing – Sending surveys shortly after a key touchpoint can yield higher response rates.
- Anonymity – Ensuring respondent anonymity encourages honest and candid responses.
By adhering to these principles, we can significantly enhance our feedback collection efforts, yielding insights that truly resonate with our customer base.
| Platform | Features | Strengths | Weaknesses |
|---|---|---|---|
| SurveyMonkey | Customizable templates, analytics | User-friendly, widely known | Limited free version |
| Typeform | Engaging designs, multimedia support | Highly interactive, aesthetically pleasing | Can be complex to set up |
| Qualtrics | Advanced analytics, integrations | Powerful for large organizations, comprehensive | Higher cost |
Analyzing NPS Results
After we collect NPS responses, the next crucial step involves analyzing NPS results to derive actionable insights. Understanding the NPS score categories—promoters, passives, and detractors—enables accurate interpretation of our overall net score.
Understanding the Score Categories
The NPS score categories serve as a framework for classifying customer opinions. Here’s a quick overview:
| Category | Score Range | Description |
|---|---|---|
| Promoters | 9-10 | Loyal customers who are likely to refer others. |
| Passives | 7-8 | Satisfied but unenthusiastic customers who could switch. |
| Detractors | 0-6 | Unhappy customers who may discourage others from engaging. |
Segmenting Responses for Deeper Insights
Response segmentation enhances our analysis by identifying patterns related to various factors. We can segment responses by:
- Demographics (age, gender, location)
- Purchase behavior (frequency, value, product type)
- Customer tenure (new vs. long-term customers)
This segmentation allows us to pinpoint specific areas needing improvement, tailoring our strategies to enhance customer loyalty effectively.
Key Metrics to Include in Your Report
Presenting a thorough overview of NPS report metrics to the board allows us to highlight critical aspects of customer sentiment. It cultivates an understanding of how we measure customer loyalty and satisfaction, which is integral to our strategic goals.
Customer Sentiment Overview
We should provide an in-depth look at customer sentiment metrics, showcasing our current NPS score along with historical data. This analysis can illustrate trends, revealing whether our customer experiences are improving or declining. Visual representation of these sentiments through graphs or tables will enhance the report’s impact.
Comparative Analysis with Industry Benchmarks
Including a comparative analysis with industry benchmarks is crucial for contextualizing our performance. By contrasting our NPS with that of competitors, we can identify areas of strength and opportunities for growth. This information not only supports our initiatives but also demonstrates our commitment to maintaining a competitive edge in the market.

Engaging in this insights-driven approach provides clarity to the board about our customers’ perceptions, urging them to value NPS as a vital component of our overall business strategy.
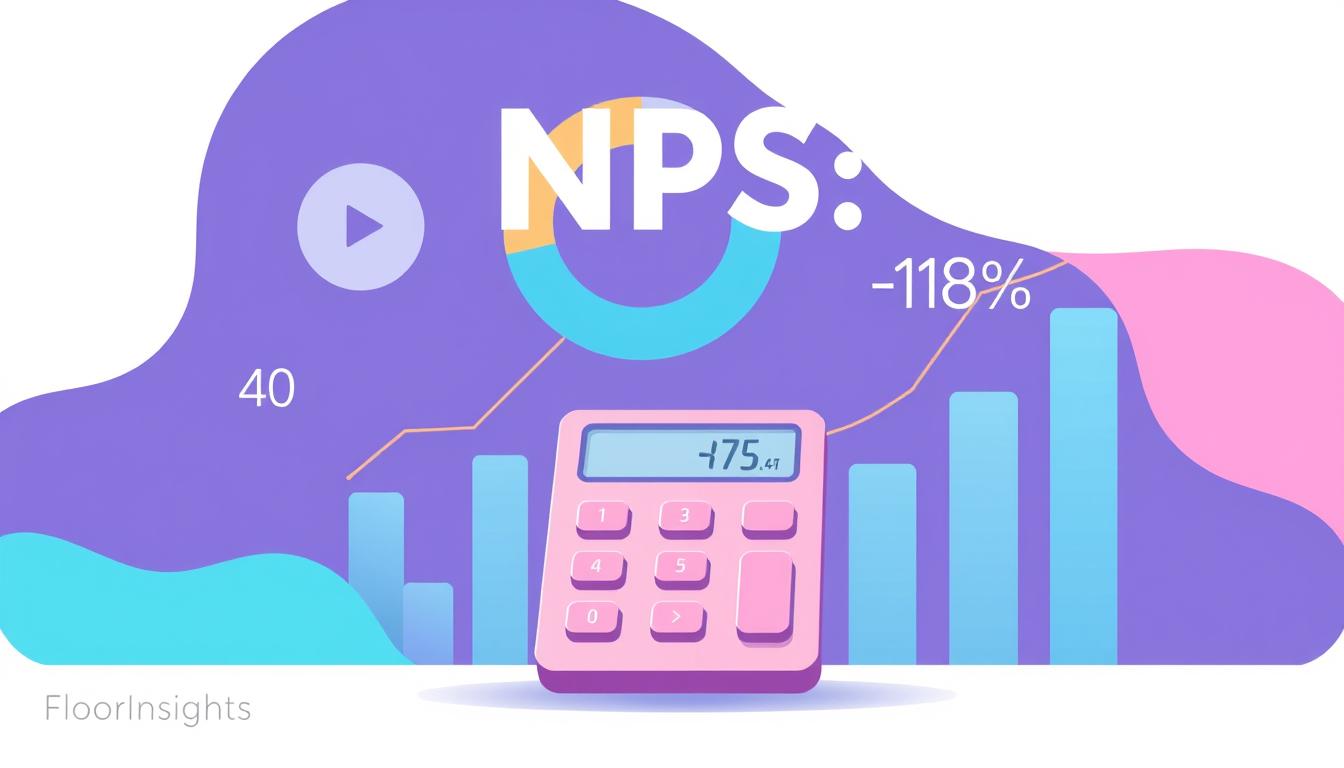
Visualizing NPS Data Effectively
Effective data presentation plays a crucial role in ensuring our audience understands the insights derived from NPS results. By visualizing NPS data, we can transform numerical scores into clear and engaging narratives. Well-constructed visuals allow us to highlight trends, showcase comparisons, and pinpoint critical insights that can drive decisions and strategies.
Using Charts and Graphs
Utilizing NPS charts and graphs can significantly enhance the clarity of our findings. These visual tools make it easier for stakeholders to grasp the implications of customer feedback. Various formats, such as line charts, bar graphs, and pie charts, each serve unique purposes in depicting our data. For instance:
- Line charts are excellent for showing trends over time.
- Bar graphs effectively compare scores across different segments.
- Pie charts provide a quick overview of customer sentiment distribution.
Highlighting Key Highlights
When presenting data, it is essential to emphasize key highlights that capture attention. We can draw focus to particular spikes or declines in our NPS scores, aligning these changes with specific events or initiatives that influenced customer sentiment. By doing so, we create a narrative that not only informs but also resonates with our audience. An actionable insights table can also serve as a quick reference during discussions:
| Month | NPS Score | Key Event |
|---|---|---|
| January | 45 | Product Launch |
| February | 30 | Service Outage |
| March | 60 | Customer Feedback Initiative |
By presenting visual data effectively, we not only enhance understanding but also pave the way for actionable discussions that can lead to improved customer loyalty and satisfaction.
Strategies for Addressing Board Concerns
When preparing to discuss our NPS report, we recognize that addressing board concerns is crucial for an effective exchange of ideas. Leadership questions often focus on various aspects such as trends in the data, response rates, and our action plan stemming from the results. By anticipating these queries, we position ourselves to provide concise answers and demonstrate our understanding of the key issues at hand.
Anticipating Questions from Leadership
It is vital to consider potential leadership questions that may arise during our presentation. Common areas of inquiry include:
- What trends are evident in the NPS data?
- How do our response rates compare to industry standards?
- What immediate actions are we proposing to enhance customer satisfaction?
Preparing Solutions for Common Feedback
In addressing board concerns, we must be ready with feedback solutions for typical comments or complaints. For instance:
- Detailing our strategies to reduce customer dropout rates.
- Outlining the process for addressing recurring complaints effectively.
- Presenting innovative initiatives aimed at improving customer engagement.
By exhibiting a proactive approach, we can inspire trust and confidence in our insights. This preparedness not only facilitates a productive dialogue with leadership but also focuses on actionable recommendations that resonate with the board’s objectives.
| Concern | Potential Questions | Proposed Solutions |
|---|---|---|
| Customer Dropout | What factors lead to dropouts? | Implement retention strategies and conduct exit surveys. |
| Complaints about Service | How are we addressing recurring issues? | Enhance training programs for staff based on feedback. |
| Engagement Levels | What initiatives can improve customer interaction? | Launch loyalty programs and targeted outreach campaigns. |
Integrating NPS with Business Strategy
Integrating NPS with our overall business strategy creates avenues for meaningful change. By linking customer feedback directly to business outcomes, we illustrate how enhancing customer satisfaction leads to increased revenue and improved retention rates. This alignment is crucial for our growth and sustainability.
Linking Customer Feedback to Business Outcomes
We can draw clear connections between the actionable insights gained from NPS and tangible business results. For instance, when customers express higher satisfaction levels, they are more likely to recommend our services, which can drive new customer acquisition and boost our market share. By actively utilizing customer feedback, we can adapt our strategies to meet market demands efficiently.
Demonstrating ROI through NPS Insights
The importance of showcasing NPS ROI cannot be overstated. Initiatives informed by NPS, such as enhanced marketing campaigns or improved customer support training, often yield substantial returns. We can demonstrate this ROI through a structured comparison of pre- and post-initiative performance metrics. This not only validates the effectiveness of our strategies but also supports ongoing investment in customer-focused initiatives.
| Initiative | Pre-NPS ROI (%) | Post-NPS ROI (%) |
|---|---|---|
| Marketing Campaign | 10% | 25% |
| Customer Support Training | 15% | 30% |
| Product Development Based on Feedback | 5% | 20% |
By effectively communicating these connections, we can align the board’s strategic vision with the insights garnered through integrating NPS. This will ultimately foster a culture focused on customer engagement and satisfaction within our organization.
Communicating NPS Impact on Growth
Effective communication of our Net Promoter Score (NPS) impact plays a pivotal role in driving business growth. By sharing NPS success stories from leading companies, we can illustrate the tangible benefits of utilizing NPS in our strategy. These case studies serve as powerful examples to inspire our teams and stakeholders, showcasing improvements in customer retention, increased referrals, and enhanced revenue. As we celebrate these success stories, we must also focus on how we can derive actionable insights from this data.
Success Stories from Other Companies
Companies like Apple and Amazon have capitalized on their NPS feedback to refine customer experiences. Apple reported a substantial rise in loyalty after implementing changes based on customer feedback, resulting in a significant uptick in product referrals. Amazon continually enhances its service model based on NPS data, leading to consistent growth in user satisfaction and sales. These NPS success stories exemplify how we, too, can leverage customer insights to fuel our business strategies.
Transforming Insights into Action
We must prioritize transforming our findings into action-oriented insights that align with our long-term growth objectives. Outlining clear next steps in response to NPS feedback fosters a proactive approach toward continuous improvement. Strategies might include targeted training for customer service teams or developing personalized marketing campaigns informed by customer preferences. By embedding these insights into our operational plans, we create a culture of innovation and accountability, enabling us to effectively communicate our NPS impact on growth.
| Company | NPS Impact | Key Actions Taken | Results Achieved |
|---|---|---|---|
| Apple | Increased customer loyalty | Implemented changes based on customer feedback | Significant increase in product referrals |
| Amazon | Enhanced user satisfaction | Refined service model using NPS insights | Consistent growth in sales |
Conclusion
In summary, our NPS reporting conclusion emphasizes the vital role of customer feedback in shaping strategic business decisions. Throughout this article, we have demonstrated how effectively communicating our Net Promoter Score through a well-prepared board NPS report can foster an understanding of customer loyalty and satisfaction. This insight not only helps us align our approaches with consumer expectations but also drives our overall business strategy.
We have also explored best practices in data visualization and proactive problem-solving strategies to address board concerns. By synthesizing our summary of NPS insights, we reinforce our commitment to using data as a cornerstone for growth and improvement. Ultimately, by presenting a robust NPS framework, we pave the way for deeper discussions around enhancing customer relationships and achieving tangible business outcomes.
As we move forward, integrating these insights into our governance and decision-making processes will be crucial. This will ensure that we not only respond to customer needs effectively but also leverage this information for informed strategic planning. Let us continue to prioritize NPS as a powerful tool for driving both customer satisfaction and organizational success.
FAQ
What is Net Promoter Score (NPS)?
Net Promoter Score (NPS) is a widely-used metric that measures customer loyalty by asking customers how likely they are to recommend our brand to others. Responses are categorized into promoters, passives, and detractors, providing insight into overall customer satisfaction.
How can we effectively report our NPS to the board?
We should include key metrics such as our current NPS score, trends over time, and a comparative analysis with industry benchmarks. It’s also essential to visualize the data effectively using charts and graphs to make our findings easily digestible for the board.
What tools are available for NPS surveys?
There are several reliable NPS survey platforms available, such as SurveyMonkey, Typeform, and Qualtrics. These platforms provide options for customization, distribution, and analytics, allowing us to gather accurate feedback from our customers.
How do we measure NPS results?
We measure NPS results by calculating the difference between the percentage of promoters and detractors. Understanding these categories helps us interpret our overall score and identify areas for improvement.
Why is NPS important for customer loyalty?
What best practices should we follow when collecting NPS feedback?
To collect effective NPS feedback, we should target the right customer segments, time our surveys appropriately, and ensure participant anonymity. This approach increases response rates and provides us with valuable insights into customer sentiment.
How can we demonstrate the ROI of NPS initiatives?
We can demonstrate ROI by linking NPS findings to business outcomes, such as increased customer retention and revenue growth resulting from improvements made based on customer feedback. Articulating these connections effectively is essential for illustrating NPS’s value to the board.
What strategies can we employ to address concerns raised by the board regarding NPS?
Anticipating questions from leadership and preparing clear, concise answers is key. We should also present actionable solutions for any common feedback or concerns, such as addressing customer drop-off rates or complaints, to demonstrate our proactive approach.
How can we visualize NPS data for our presentation?
We can enhance our presentation by using well-designed charts and graphs that illustrate trends and key insights in our NPS data. Highlighting significant changes alongside relevant initiatives will help the board better understand the implications of the scores.
How do we integrate NPS insights into our broader business strategy?
Integrating NPS insights involves linking customer feedback to key business outcomes. By showing how improvements in customer satisfaction translate into measurable results, we can better align our strategic goals with customer needs and preferences.