In today’s competitive market, effective customer retention strategies are essential for sustained growth, especially for B2B companies. By leveraging the Net Promoter Score (NPS) methodology, a B2B company in India has managed to substantially increase customer loyalty and, as a result, doubled their retention rates. This transformation showcases the significant impact of understanding and applying customer feedback through NPS surveys.
Net Promoter Score has proven to be a vital tool for gauging customer satisfaction and loyalty. By accurately measuring the likelihood of customers recommending the company to others, this Indian B2B firm was able to refine their approach to customer relationships, ensuring a long-term commitment that fostered loyalty and retention.
Key Takeaways
- The implementation of NPS can dramatically improve customer retention in B2B companies.
- Accurate NPS data provides critical insights into customer satisfaction and loyalty.
- Understanding customer feedback through NPS surveys can refine business strategies.
- B2B growth strategy should include regular measurement and analysis of NPS.
- Focusing on improving NPS can result in substantial business growth and customer loyalty.
Introduction to NPS
The Net Promoter Score (NPS) has emerged as a powerful metric for understanding customer loyalty, especially within the B2B sector. It offers a straightforward approach to gathering and analyzing customer feedback, allowing companies to gauge their clients’ sentiments and make informed business decisions.
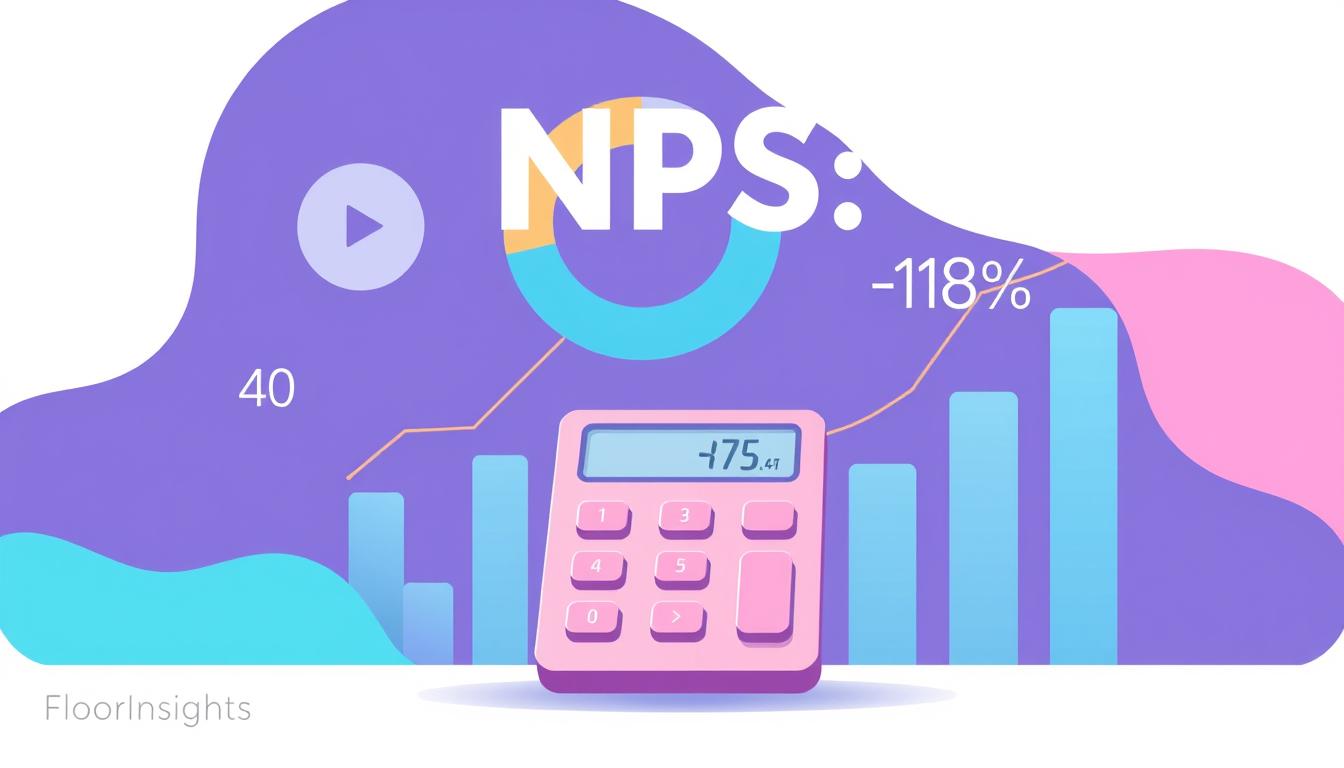
What is NPS?
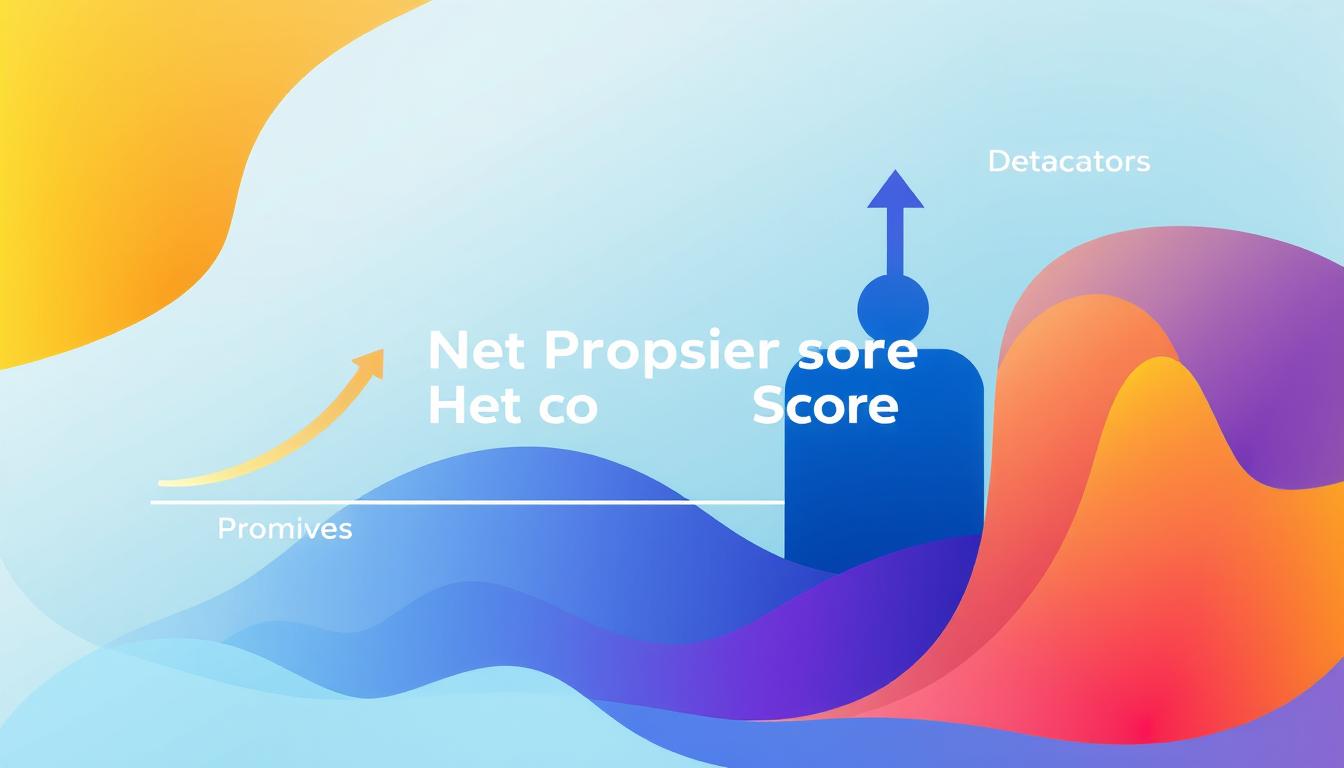
At its core, the Net Promoter Score Calculation involves asking customers a single, crucial question: “How likely are you to recommend our company to a friend or colleague?” Responses are collected on a scale of 0 to 10, enabling businesses to categorize customers into three groups:
- Promoters (scores 9-10): Loyal enthusiasts who will keep buying and refer others, fueling growth.
- Passives (scores 7-8): Satisfied but unenthusiastic customers who are vulnerable to competitive offerings.
- Detractors (scores 0-6): Unhappy customers who can damage your brand and impede growth through negative word-of-mouth.
The final NPS score is derived by subtracting the percentage of Detractors from the percentage of Promoters.
Importance of NPS in B2B Companies
The significance of the NPS Survey in the B2B realm cannot be overstated. Companies that track and improve their Net Promoter Score often witness enhanced B2B Customer Experience and strengthened client relationships. One of the most compelling reasons for using NPS is its ability to act as a predictive indicator of business growth.
B2B companies often have more complex and longer sales cycles than B2C firms. Therefore, it becomes crucial to maintain strong relationships with existing customers. By regularly conducting NPS Surveys, businesses can spot any dissatisfaction early, take corrective actions, and retain critical accounts, hence preventing client churn.
Moreover, by identifying Promoters, companies can leverage these satisfied clients for case studies, testimonials, and referrals, further driving growth.
| Category | Implication |
|---|---|
| Promoters (9-10) | Drive growth and act as brand advocates |
| Passives (7-8) | Neutral; open to competitive offers |
| Detractors (0-6) | Potentially harm the brand through negative word-of-mouth |
In conclusion, understanding and implementing the Net Promoter Score Calculation through targeted NPS Surveys can significantly elevate the B2B Customer Experience, making it an indispensable tool for sustainable business growth.
The Business Challenge: Retention Issues
When it comes to client retention challenges, B2B companies often face a myriad of obstacles. The high cost of acquiring new customers compared to retaining existing ones is a persistent issue that underscores the critical importance of customer loyalty. In fact, numerous industry studies have documented that retaining a customer is significantly less costly than acquiring a new one.
Understanding and evaluating the B2B customer loyalty metric becomes essential in addressing these retention issues. Successful B2B companies recognize that high retention rates are indicative of long-term stability and growth. While the initial focus of many businesses might be on expansion, it’s the retention of clients that truly fuels sustainable development.
Several market analyses highlight that companies with robust retention strategies usually report higher ROI. Furthermore, they enjoy increased trust and rapport with clients. This deep-seated relationship is a key factor in navigating the competitive business landscape, enhancing overall loyalty.
| Aspect | Acquisition Cost | Retention Cost | Impact on Loyalty |
|---|---|---|---|
| Initial Investment | High | Low | Moderate |
| Long-term Engagement | Moderate | High | Significant |
| Trust Building | Low | High | Essential |
Tackling client retention challenges involves more than just focusing on short-term gains. B2B companies must continuously refine their strategies to maintain a competitive edge, ensuring their B2B customer loyalty metric accurately reflects a dedicated client base. Through targeted efforts, businesses can foster enduring relationships that translate into consistent revenue and sustained growth.
The Implementation of NPS
Implementing NPS within a company requires strategic planning and execution. Integrating NPS best practices is essential to ensure the system’s success in accurately measuring customer loyalty and satisfaction.
Steps Taken to Introduce NPS
To introduce NPS, we followed a systematic approach that involved:
- Securing buy-in from key stakeholders to ensure commitment to the NPS initiative.
- Conducting training sessions for employees across all relevant departments to highlight the importance and benefits of NPS.
- Deploying a pilot program to test the effectiveness of NPS before rolling it out company-wide.
- Implementing NPS tools and software to streamline the feedback collection and analysis process.
- Continuously reviewing and adjusting our strategy based on initial feedback to optimize the system’s performance.
Choosing the Right NPS Survey Questions
The success of NPS largely depends on formulating effective NPS questions. We prioritized selecting NPS best practices for crafting survey questions to capture actionable insights. Key considerations included:
- Including open-ended questions to uncover detailed feedback and specific areas for improvement.
- Avoiding leading questions to ensure unbiased and genuine responses from customers.
- Regularly updating survey questions to stay aligned with changing customer expectations and industry trends.
By adhering to these principles, we were able to formulate effective NPS questions that have provided us with invaluable insights into customer loyalty and areas needing attention.
Monitoring NPS: Tracking Promoters and Detractors
When it comes to NPS Tracking, real-time monitoring plays a vital role in capturing both promoters and detractors. Understanding Promoters and Detractors enables us to make informed business decisions and drive customer relationship improvements.
Tracking promoters helps us identify our most loyal customers, while understanding detractors allows us to address pain points and improve our services. By regularly analyzing our NPS data, we can segment our audience and tailor our strategies accordingly.
To effectively monitor NPS, we utilize different strategies:
- Real-time dashboards
- Automated surveys
- Customer feedback loops
Having these tools in place ensures that we stay ahead of potential issues and enhance positive experiences.
Monitoring NPS helped our company to swiftly address customer concerns, turning detractors into promoters and significantly boosting our retention rates,” stated a leading industry expert.
We can see a direct correlation between our tracking efforts and improvements in customer relationships. This deliberate and meticulous approach has proven invaluable for long-term growth and customer satisfaction.
| Metrics | Promoters | Detractors |
|---|---|---|
| Response Rate | 45% | 30% |
| Customer Retention | 90% | 60% |
| Feedback Resolution Time | 24 hours | 48 hours |
These metrics provide insights into our performance, allowing us to continually refine our approach to NPS Tracking and better accommodate our clientele.
Customer Feedback and Insights
Understanding how to interpret customer feedback is vital for any thriving business. In this section, we elucidate how NPS Data Analysis can transform raw data into actionable insights, ultimately leading to improved customer experiences and increased loyalty.

Analyzing NPS Data
NPS Data Analysis involves an in-depth review of responses gathered through Net Promoter Score (NPS) surveys. By segmenting the respondents into promoters, passives, and detractors, we can identify trends that highlight areas for improvement. Promoters’ feedback often points to what works well while detractors‘ comments shed light on pain points.
Conducting a thorough NPS Data Analysis helps us comprehend what drives customer satisfaction and loyalty, enabling us to make informed decisions that enhance our service.
Actionable Insights from NPS Surveys
Actionable insights from NPS surveys can lead to tangible improvements in multiple facets of a business. Following the data analysis, the feedback can be categorized based on recurring themes. Implementing changes based on these themes translates to immediate enhancements in customer service, product offerings, or operational processes.
Below is an illustrative example of actionable insights derived from NPS surveys:
| NPS Segment | Feedback Theme | Action Taken |
|---|---|---|
| Promoters | Appreciation for swift customer support | Increased resources for support team |
| Passives | Desire for more product features | Launched new product updates based on feedback |
| Detractors | Issues with product usability | Revamped user interface for enhanced usability |
Impact of NPS on Customer Loyalty
A well-implemented Net Promoter Score (NPS) program can be a game-changer in bolstering customer loyalty. Many businesses have observed the tangible NPS Impact on their customer relations, resulting in both short-term wins and long-term advantages. But how precisely can we measure these improvements?
Measuring Customer Loyalty Improvement
Measuring Customer Loyalty Improvements involves carefully monitoring several key metrics before and after the implementation of an NPS strategy. Below is a detailed table showcasing how NPS affects various aspects of customer retention.
| Metrics | Pre-NPS Implementation | Post-NPS Implementation |
|---|---|---|
| B2B Retention Rates | 75% | 85% |
| Customer Satisfaction Score | 70% | 90% |
| Repeat Purchase Rate | 40% | 65% |
These metrics clearly illustrate the profound NPS Impact on B2B Retention Rates. Initiating an NPS program can significantly enhance customer loyalty, translating into sustained business growth and a robust competitive edge.
Net Promoter Score as a Metric for Success
Establishing a Net Promoter Score (NPS) metric is pivotal for businesses striving to improve customer satisfaction and loyalty. Effective utilization of NPS requires setting precise benchmarks and understanding how these figures compare with industry standards. Moreover, regular assessment of these metrics can help organizations stay ahead of the competitive curve.
Setting NPS Benchmarks
Setting NPS benchmarks involves determining realistic targets that reflect the company’s goals and customer expectations. By analyzing historical data and current trends, businesses can establish benchmarks that serve as a tangible measure of progress.
We found that establishing clear NPS benchmarks motivates our team and sets a unified target to enhance customer experiences,” said a spokesperson from Apple.
Businesses often rely on industry reports and surveys to decide on optimal benchmarks. These sources provide detailed insights into sector-specific averages, helping companies to set achievable yet ambitious goals. Furthermore, ongoing evaluation of these benchmarks is essential to adapt to changing market dynamics and customer sentiments.
Comparing NPS with Industry Standards
To gauge the effectiveness of their NPS initiatives, firms must compare their scores with those considered as industry standards. Doing so helps in identifying areas requiring improvement, and enables companies to prioritize strategies that foster customer loyalty.
| Industry | NPS Benchmarks | Industry Standard NPS |
|---|---|---|
| Technology | 45+ | 50 |
| Retail | 30+ | 35 |
| Healthcare | 25+ | 30 |
| Financial Services | 50+ | 55 |
Regularly comparing internal performance against industry benchmarks enables a business to fine-tune its strategies and enhance overall customer satisfaction. Additionally, continuous monitoring of NPS ensures that companies remain aligned with dynamic customer expectations and competitive standards.
Case Study: Real-Life Success
Our journey begins with an in-depth look at how a well-known company successfully implemented the Net Promoter Score (NPS), transforming their customer retention strategy and driving significant growth. This NPS Implementation Case Study highlights the company’s innovative approach and the monumental impact of embracing NPS.
Company Background
The company in focus is a leading B2B enterprise operating in the technology sector. Established over a decade ago, they provide advanced software solutions to businesses worldwide. Their expansion was impressive; however, they faced the challenge of retaining their rapidly growing customer base. This set the stage for introducing the NPS as a crucial element of their strategy.
Before and After NPS Implementation
Prior to NPS implementation, the company struggled to gauge customer satisfaction effectively. Their retention rates were fluctuating, leading to inconsistent growth patterns. The introduction of the NPS provided a clear metric for understanding customer loyalty and pinpointing areas of improvement. Let’s delve into the remarkable before-and-after scenario.
| Metrics | Before NPS Implementation | After NPS Implementation |
|---|---|---|
| Customer Retention Rate | 67% | 85% |
| Average NPS Score | 21 | 54 |
| Churn Rate | 15% | 5% |
| Monthly Recurring Revenue (MRR) | \$1.2 Million | \$2.5 Million |
This B2B NPS Success Story underscores the tangible benefits realized by the company. The implementation of NPS empowered them to foster profound customer loyalty, drastically reduce churn, and significantly boost their Monthly Recurring Revenue (MRR). This NPS Implementation Case Study illustrates the power of a strategically executed NPS program, reshaping the company’s growth trajectory and reinforcing their position as an industry leader.
Lessons Learned and Best Practices
Throughout our journey implementing Net Promoter Score (NPS), we have gathered valuable insights that can significantly aid in maximizing NPS Efficiency. By leveraging these lessons, your organization can enhance the effectiveness of its NPS strategy and avoid common pitfalls.
Tips for Maximizing NPS Efficiency
To optimize NPS Efficiency, it’s crucial to focus on several key areas. Firstly, ensure that your NPS surveys are efficiently designed to capture relevant and actionable feedback. This involves asking the right questions that align with your business objectives. Secondly, establish a clear and consistent follow-up process to address any issues raised by detractors swiftly and effectively.
Additionally, leveraging data analytics tools can provide deeper insights into customer sentiments, enabling your team to make informed decisions. Regular training for staff on NPS Best Practices can also drive consistent improvements in customer service and overall experience.
Avoiding Common Mistakes with NPS
One of the most frequent NPS Mistakes is failing to take immediate action on the feedback received. It’s imperative to close the feedback loop by addressing customer concerns promptly. Another common error is not segmenting the NPS data by different customer demographics, which can lead to a generalized and less effective approach.
Moreover, over-relying on NPS as the sole metric for customer satisfaction can be misleading. It’s essential to combine NPS with other qualitative and quantitative measures to gain a well-rounded understanding of customer loyalty and areas needing improvement.
By adhering to these NPS Best Practices and avoiding typical NPS Mistakes, businesses can substantially improve their NPS Efficiency and enjoy increased customer retention and satisfaction.
“Customer feedback is the compass that guides your company’s journey towards continuous improvement and success.”
Conclusion
In our exploration of how the Net Promoter Score (NPS) can profoundly impact customer retention, we’ve unearthed several critical insights. From understanding what NPS is and its significance to B2B companies, to navigating implementation challenges and monitoring customer feedback—every step contributes to an effective NPS strategy. These concerted efforts ultimately bolster customer loyalty and retention.
By delving into the real-life successes and learning from best practices, it’s evident that a well-executed NPS strategy delivers measurable improvements. Companies that actively listen and respond to customer feedback are better positioned to foster enduring relationships, translating to sustained business growth.
As we conclude, it is clear that integrating NPS as a pivotal element of customer relationship management and operational strategy is not just beneficial but essential. Businesses aiming to elevate customer satisfaction and loyalty should consider NPS not as a mere metric but as a transformative tool that underpins their customer retention strategy.
FAQ
What is NPS?
NPS, or Net Promoter Score, is a customer loyalty metric that measures the likelihood of customers recommending a company’s products or services to others. The score is calculated based on responses to a single question: “On a scale of 0 to 10, how likely are you to recommend our product/service to a friend or colleague?”
How is NPS calculated?
NPS is calculated by subtracting the percentage of detractors (those who score 0-6) from the percentage of promoters (those who score 9-10). Passive respondents (scoring 7-8) are excluded from the calculation. The final score ranges from -100 to +100.
Why is NPS important for B2B companies?
NPS is crucial for B2B companies as it serves as a predictive indicator of business growth, customer satisfaction, and client churn rate. It helps businesses identify strengths and areas for improvement, directly impacting customer retention and loyalty.
What are common client retention challenges in B2B companies?
B2B companies often face challenges such as high customer acquisition costs, long sales cycles, and complex decision-making processes. Retention is critical as it is generally more cost-effective to maintain existing customers than to acquire new ones.
What steps should be taken to introduce NPS in a company?
What are effective NPS survey questions?
Effective NPS survey questions are clear, concise, and focused on the customer’s overall experience and likelihood to recommend. Key examples include: “How likely are you to recommend our product/service?” and “What is the primary reason for your score?”
How can we track NPS effectively?
NPS can be tracked through regular, consistent surveys and monitoring the proportion of promoters, passives, and detractors. Using CRM systems and analytics tools helps in capturing real-time data and identifying trends over time.
How is NPS data analyzed?
NPS data analysis involves categorizing responses, identifying trends, and pinpointing common factors influencing scores. This can be done via statistical analysis, text analytics for open-ended responses, and by comparing results against historical data.
What actionable insights can be derived from NPS surveys?
Actionable insights from NPS surveys include identifying customer pain points, enhancing customer service, improving products, and crafting targeted marketing strategies. These insights help in making informed business decisions that bolster customer satisfaction and loyalty.
How does NPS impact customer loyalty?
What are NPS benchmarks?
NPS benchmarks are standards set by a company or industry to measure the effectiveness of their NPS scores. Benchmarks help organizations understand their performance relative to competitors and set realistic goals for improvement.
How do we compare our NPS with industry standards?
Comparing NPS with industry standards involves evaluating your score against average scores within your industry. Industry reports and surveys can provide insight into these averages, helping you gauge where you stand and identify areas for improvement.